Immunostaining data vizualization
Immunostaining is one of the widely used methods by the cell biolgists to evaluate kinatics of DNA repair. A very common example of such technique could be staining gH2AX or RAD50 proteins in the nucleus and measure DNA repair kinetics.
For the sake of the discussion lelt’s assume there is a wild type cell line (WT) and a mutant cell line (MUT); the MUT is incapable of repair double strand break (DSB). We grow both of the cell lines in same condition and then expose them to ionizing radiation to induce DSB 1. Upon sensing the DSB, the cells will activate some pathways via some signaling so that the DSB is repaired and the genome become intact.
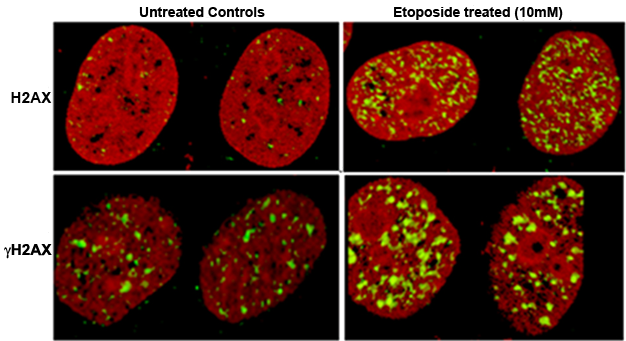
Histones are abundant proteins on the DNA, one of them is H2A, combinedly called H2AX. After sensing DSB these H2AX are phorphorylated at Serine-139 and then the H2AX are called phosphorylated H2AX or γH2AX. Presence of γH2AX are the marker for unrepaired DSB. These proteins are fixed in situ and tagged with fluorescent antibody. Afterwards they can be easily visualized via microscopy. Generally they appear as small spots and are called γH2AX foci.2
Let’s get back to our experiment. Because the MUT cell line will fail to repair DSB, the γH2AX foci around DSB sites will be consistently high. On the other hand, for the WT cell line, initially the γH2AX foci count will be high and eventually will reduce, as the DNA is repaired. For instance, if we collect samples 30 minutes, 1 hr and 2 hr after exoposing IR, for the WT cells foci count at 30 minutes will be highest which will gradually return to normal level by 1 hr and 2 hr.
In this blog we will discuss the following things:
- How to save the data.
- How to vizualize them.
Historically cell biologists utilize spreadsheets i.e MS Excel or any similar apps and record the data. I and some of my colleagues use the following pattern to recod the data.
| WT_IR_0 | WT_IR_30 | WT_IR_60 | WT_IR_90 | MUT_IR_0 | MUT_IR_30 | MUT_IR_60 | MUT_IR_90 |
|---|---|---|---|---|---|---|---|
| 10 | 10 | 0 | 0 | 10 | 10 | 0 | 0 |
| 10 | 10 | 0 | 0 | 10 | 10 | 0 | 0 |
| 10 | 10 | 0 | 0 | 10 | 10 | 0 | 0 |
| 10 | 10 | 0 | 0 | 10 | 10 | 0 | 0 |
| 10 | 10 | 0 | 0 | 10 | 10 | 0 | 0 |
| 10 | 10 | 0 | 0 | 10 | 10 | 0 | 0 |
| 10 | 10 | 0 | 0 | 10 | 10 | 0 | 0 |
| 10 | 10 | 0 | 0 | 10 | 10 | 0 | 0 |
Each of the columns are representing experiemntal condition and each of the rows are indicating the respective foci numbers in a sigle cell. This format is often refrred to as wide form of data. Generally, this types of experiments enlist 50 of such observations. Three replicates are done of the experiments and then consecutive statistical analyses are done. This will be discussed in a near future blog. However, there are substantial drawbacks with this formating:
- First of all this is not a tidy data.
- This format is problematic to handle.
Before showing the right format we will actually show how to convert this format to a tidy format.
-
Initially it could be single strand break or any other anomaly in the DNA which eventually is converted to a DSB. ↩
-
γH2AX: a sensitive molecular marker of DNA damage and repair ↩