Heatmap with theme RdYlBu
2022, Aug 02
Make a heatmap
Here we will learn to make a heatmap by taking RdYlBu as colormap or theme
Import library
import numpy as np
import pandas as pd
import matplotlib.pyplot as plt
import seaborn as sns
Generate Data
df = pd.DataFrame(np.random.rand(4,3),columns=["A","B","C"] )
df.head()
| A | B | C | |
|---|---|---|---|
| 0 | 0.996340 | 0.214264 | 0.556522 |
| 1 | 0.081258 | 0.576770 | 0.893816 |
| 2 | 0.159397 | 0.189863 | 0.378016 |
| 3 | 0.995932 | 0.263881 | 0.128237 |
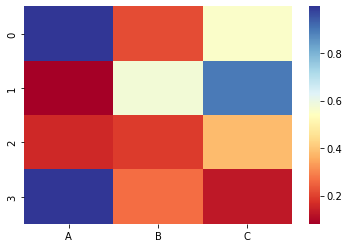
Plot Heatmap
sns.heatmap(df,
            cmap="RdYlBu"
           )
plt.show()
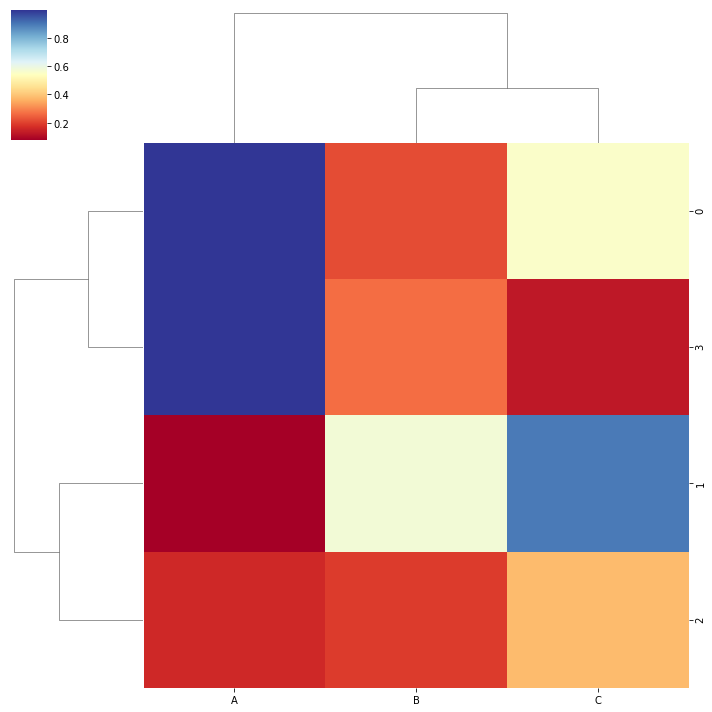
Plot cluster map
sns.clustermap(df,
            cmap="RdYlBu"
           )
plt.show()
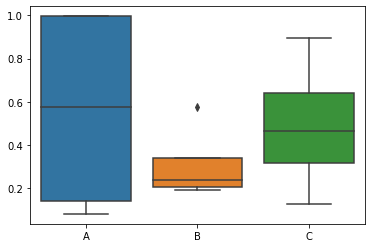
sns.boxplot(data=df)
plt.show()